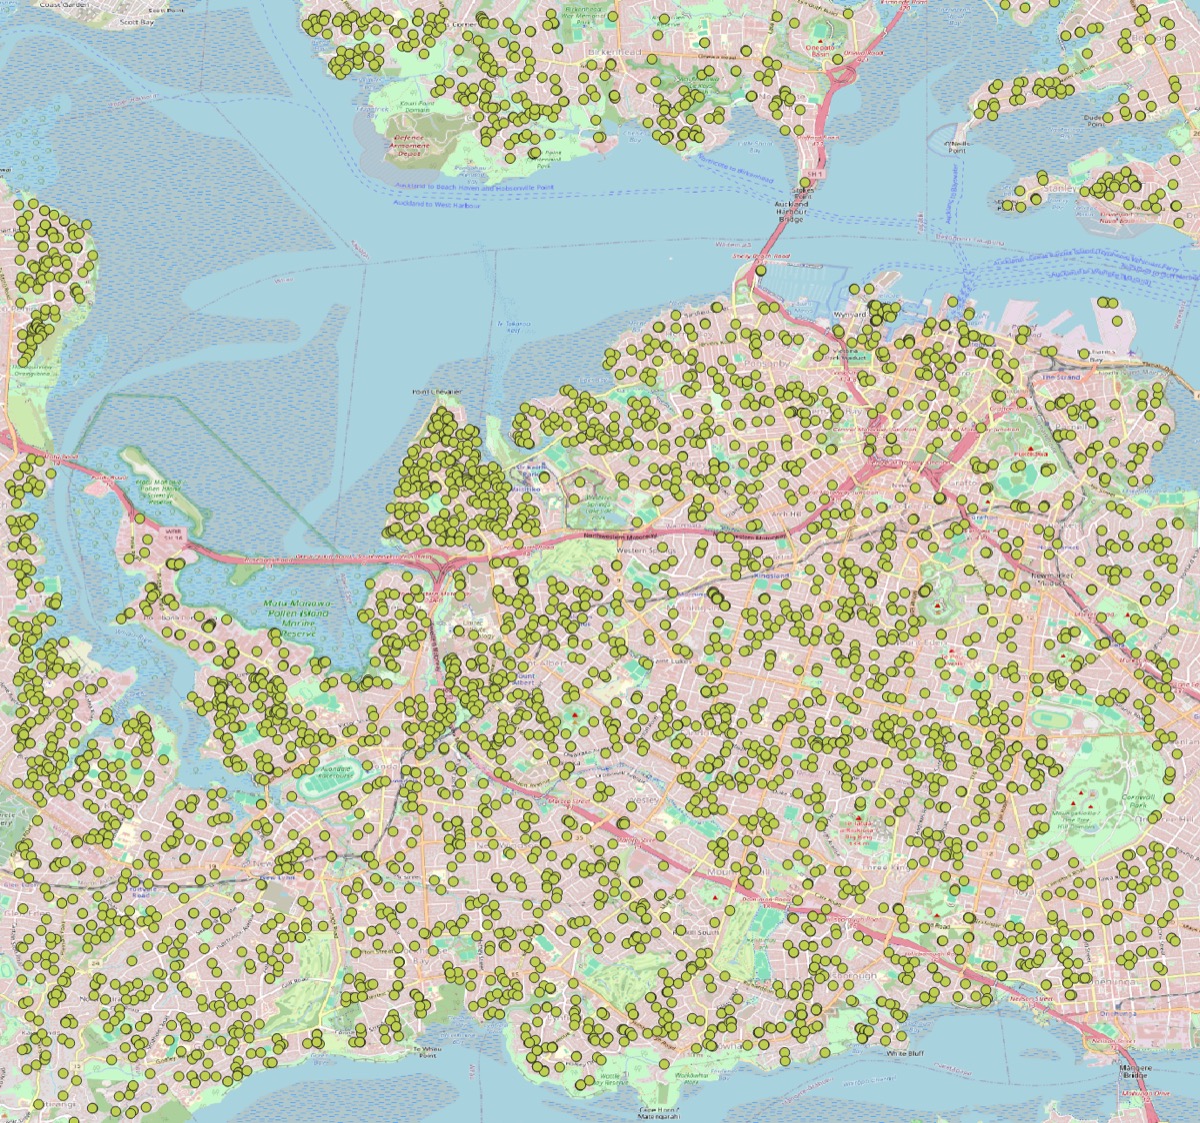

Detecting Rooftop Solar from high-resolution aerial imagery — scalable Roboflow inferencing + spatial clustering - Auckland case study
Across New Zealand suburbs rooftop solar PV adoption is patchy and often unexplained by simple economic signals. Ever wondered: where are the gaps - and is there a way to explain their location? This project turns publicly available high‑resolution aerial imagery (LINZ 7.5 cm) into an actionable dataset of rooftop solar locations, then uses spatial statistics to reveal clusters and gaps that local government and industry can target. The implementation combines a Roboflow/YOLO detector with an AWS Batch pipeline deployed via Terraform, produces georeferenced detections (GeoJSON), and supplies scripts for tiling, uploading, inference, and postprocessing.
Why this matters
- No public register: deriving installations from imagery fills a critical data gap for planning and outreach.
- Low friction, high scale: reuse a proven Roboflow detector, containerize inference, and scale with AWS Batch + Terraform.
- Actionable outputs: GeoJSON polygons/points and simple “gap scores” let stakeholders prioritize neighbourhoods for engagement or subsidy.
Project overview
- Input: LINZ 7.5 cm aerial imagery (GeoTIFF / geo‑JPEG).
- Detection: Roboflow workflow or local Ultralytics YOLO model.
- Infra: S3, AWS Batch (GPU), CloudWatch, IAM, provisioned by Terraform.
- Outputs: GeoJSON (EPSG:4326) of polygon detections with confidence scores; optional PostGIS upload for spatial joins and analysis.
- Spatial analysis: kernel density, DBSCAN/HDBSCAN clustering, (Global Moran’s I), nearest‑neighbour, and per‑area “PV utilization” scores for outreach prioritization.
End‑to‑end flow
- Tile imagery: rasterio tiles large GeoTIFFs into overlapping chips (default 1024 px, 256 px overlap) and records tile metadata (transform, CRS, resolution).
- Upload tiles: tile files + sidecar metadata uploaded to S3 (bucket created by Terraform).
- Batch inference: an AWS Batch job runs a containerized inference script over S3 tiles (Roboflow workflow API or local YOLO).
- Georeference: pixel bounding boxes → world polygons via per‑tile transforms, converted to EPSG:4326.
- Postprocess & store: write GeoJSON to S3; optionally push detections into PostGIS for joins with building footprints and census data.
- Spatial analytics: produce density maps, clusters (DBSCAN/HDBSCAN), spatial autocorrelation (Moran’s I), and area scores identifying gaps and clusters.
Repository highlights - what’s included in solar-pv-inferencing
- tile_and_upload_to_s3.py — rasterio-based tiler + uploader (tile size, overlap configurable).
- s3_yolo_infer.py — example inference runner: streams tiles from S3, calls Roboflow workflow or local model, converts detections to georeferenced GeoJSON, optionally uploads to PostGIS.
- infra/ (Terraform) — batch.tf, s3.tf, iam.tf, cloudwatch.tf, variables.tf plus scripts/infer_pv_s3.py (inference entrypoint).
- Dockerfile — builds the inference container used by AWS Batch.
- submit_inference_job.sh, submit_test_job.sh, check_job.sh, cancel_job.sh — job lifecycle helpers.
- Utilities: rebuild_container.sh, test_local.py, and README usage examples.
Key technical details and rationale
Tiling and georeferencing
- Default tiling (1024 px or 2048 px with 25% overlap) protects against missed detections at tile edges; overlap is adjustable.
- Tile metadata records rasterio transform and CRS so detector pixel coordinates can be reliably converted to world coordinates (pixel_to_world, bbox_pixels_to_world helpers).
Detection modes
- Roboflow workflow API: easy iteration and hosted inference; submit base64 image to workflow endpoint and parse returned predictions. Read workflow_id and api_key from SSM or environment.
- Local model (Ultralytics YOLO): include model weights in the container or download from S3 at startup for lower-latency, offline runs and predictable throughput.
s3_yolo_infer.py — behavior summary
- Lists and streams tiles from S3 (vsis3 path or download fallback).
- Loads Roboflow credentials from AWS SSM or env vars. If workflow_id is present, uses the HTTP API; otherwise loads a local model via get_model().
- For each tile: runs inference, converts detections to shapely polygons using tile transform, collects GeoJSON features, writes local GeoJSON and uploads to S3.
- Optional: uploads detections into PostGIS using psycopg2 for spatial analysis and joins.
AWS architecture (Terraform‑provisioned)
- S3: separate prefixes for tiles and outputs; lifecycle rules recommended to clean intermediates.
- AWS Batch: compute environment with GPU instances (g4dn.xlarge, g5.xlarge, g6.xlarge supported), job queue, and job definition. Batch supports spot instances for cost savings.
- IAM: minimal roles/policies for Batch tasks to read S3 and SSM (Roboflow creds).
- CloudWatch: log groups seeded by Terraform for Batch job logs.
- Terraform: infra/ contains variables.tf to parameterize region, bucket names, instance types; use remote state (S3 + DynamoDB locking) for team workflows.
Scaling & operational pattern
- Shard by geography: split tiles into bounding‑box shards and submit parallel Batch jobs per shard.
- Model packaging: bake weights into the container for high‑throughput runs; for rapid experimentation pull via Roboflow at job start and cache weights on the worker filesystem.
- Cost control: use spot instances, mixed instance types, S3 lifecycle policies, and tagging to allocate cost.
- Resilience: Batch handles retries; incorporate CloudWatch alarms for job failures and process throughput.
Validation & quality control
- Human‑in‑the‑loop: spot‑check early outputs to estimate precision/recall and collect false positives/negatives for retraining.
- Threshold tuning: set confidence and IOU thresholds using small labelled samples before large runs.
- Edge cases: small arrays, heavy shadowing, reflective roofs and non‑PV rooftop objects (satellite dishes, HVAC) are common sources of false positives—include these in your Roboflow training dataset.
Postprocessing & analytics
- Convert polygons to centrepoints for cluster statistics or keep polygons where area/shape matters.
- Use geopandas + scikit‑learn/hdbscan for DBSCAN/HDBSCAN clustering and kernel density estimation.
- Compute Global Moran’s I and nearest‑neighbour metrics for spatial autocorrelation.
- Produce per‑area PV utilization scores to rank suburbs for outreach.
Practical, repo‑based commands
- Store Roboflow creds in SSM:
aws ssm put-parameter –name “/roboflow/model_id” –value “your-workspace/your-model-version” –type “String” –region ap-southeast-2
aws ssm put-parameter –name “/roboflow/api_key” –value “your-roboflow-api-key” –type “SecureString” –region ap-southeast-2 - Deploy infra: cd infra/ && terraform init && terraform apply
- Tile & upload imagery: python tile_and_upload_to_s3.py –input-dir “path/to/aerials” –s3-bucket “solar-panel-inference-data” –s3-prefix “tiles/” –tile-size 1024 –overlap 256
- Submit inference: ./submit_inference_job.sh
- Download detections: aws s3 cp s3://solar-panel-inference-data/outputs/detections.geojson ./results.geojson
Limitations and caveats
- Detection quality varies: even at 7.5 cm small arrays and difficult lighting can cause missed detections or false positives. Validate results before using them to make operational decisions.
- Clustering ≠ causation: spatial clusters and gaps are useful signals but must be combined with socioeconomic, regulatory, and solar‑resource data to identify drivers.
- Cost: city‑ or nation‑scale runs require careful cost management (spot instances, batching, lifecycle rules).
Production recommendations
- CI/CD: automatically build and tag inference container images (include model version).
- Automated validation: schedule periodic evaluation on a labeled holdout to detect model drift and trigger retraining.
- Monitoring: CloudWatch dashboards for tile throughput, job failures, and inference latency; cost dashboards for batch runs.
- Retraining loop: capture false positives/negatives from spot checks back into Roboflow training datasets and iterate models.
- Data platform: store validated detections in PostGIS for efficient downstream joins with building footprints, census layers, and solar potential rasters.
Conclusion
This repository offers a practical, productionizable path from LINZ 7.5 cm aerial imagery to georeferenced rooftop PV detections and spatial statistics. The stack—rasterio tiling, Roboflow/YOLO detection, containerized inference, AWS Batch for scale, Terraform for reproducible infra, and PostGIS for analysis—lets you move from a local demonstrator to city‑ or nation‑scale processing with well understood operational steps: shard imagery, run GPU batch jobs (spot for cost), postprocess to GeoJSON/PostGIS, validate, and iterate.


